Dashboard
This article provides an overview of the Dashboard within TES®. Located within the Manage menu, this area provides users with a visual display of important user and account information within the application.
In this article:
The TES Dashboard provides users with insight into the following within TES®:
- The institution's distribution of equivalencies across the United States.
- Catalogs added in the past 30 days for schools to which the institution has equivalencies.
- The institution and the individual user's account activity.
- The individual user's assigned evaluation tasks.
- The institution's evaluation activity.
- The catalogs that are currently on the institution's watchlist.
All users can access the Dashboard, regardless of user rights. When specific user rights are required to view information, it is noted below. To access the Dashboard from within TES:
- Go to the Manage menu.
- Select Dashboard.
Where are equivalencies distributed?
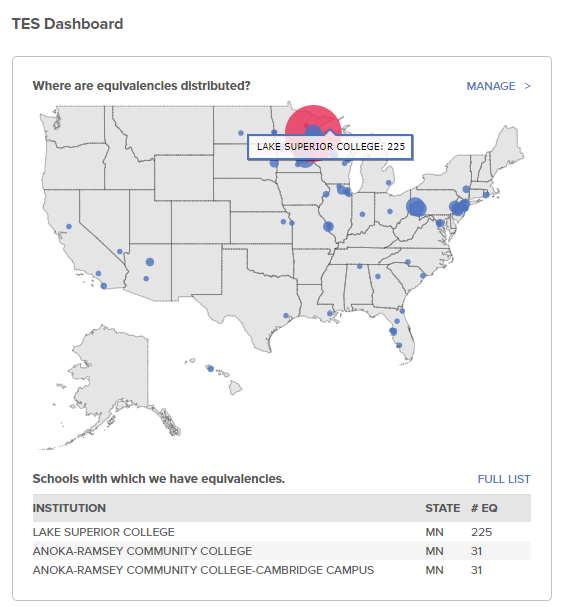
This section of the Dashboard displays an infographic showing where the college or university has equivalencies established at institutions across the United States. The larger the bubble, the more equivalencies were created at that institution or institutions within that region. When proactively building equivalencies, this information can help a college or university determine which geographical regions may need additional focus to attract more students.
Hover over the circle(s) to see the institution(s) to which course equivalencies were created and the number established at each.
- Example: LAKE SUPERIOR COLLEGE: 225
Users with the CREATE EQ user right can select MANAGE to be taken to the Equivalency Manager, where a listing of all established equivalencies resides. From here, equivalencies can be viewed, edited, or deleted.
Schools with which we have equivalencies
Within the Dashboard, users can see a listing of schools with which the institution has established equivalencies. By default, the three schools to which the largest number of equivalencies have been established will appear within the grid. To see a listing of all institutions, select FULL LIST.

| Field | Description |
| INSTITUTION | The name of the school or institution. |
| STATE | The state in which the school or institution resides. |
| #EQ | The number of equivalencies established between courses at the sending and receiving institutions. This includes active, inactive, and any duplicate equivalencies. |
Catalogs added in the past 30 days for schools with defined equivalencies.
Within this section, users can see a running list of institutions with whom at least one equivalency has been established that have had a new catalog added to TES® in the last 30 days. Up to 10 institutions will appear by default. To see a listing of all institutions whose catalogs meet this criteria, select FULL LIST. It is important to note that the catalog added may not necessarily be the most current edition; this section reports those that are new to TES.

| Field | Description |
| INSTITUTION | The name of the school or institution. |
| STATE | The state in which the school or institution resides. |
| #EQ | The number of equivalencies established between courses at the transfer and home institution; includes active, inactive, and any duplicate equivalencies. |
Select the hyperlinked institution name to be taken to Course Finder 2. From here, the user can view the information contained within the data sets.
Catalogs are continually being added to TES. Check back often, as the institution reported may change.
USER ACTIVITY
The USER ACTIVITY section of the Dashboard provides general information about the institution's use of TES®.

Within this section, individuals can view:
- The total number of users at an institution.
- The number of users who were logged into TES at the time the Dashboard loaded.
- The number of users who have logged into TES this week (12:00 a.m. PT Sunday through 11:59 p.m. PT Saturday).
- The number of users who have not logged into TES within the last 30 days.
- The number of users who have not logged into TES within the past year (current date minus 365 days).
TES Administrators can access additional information about individual user activity through the User Management page or the Usage Statistics reports. If a TES Administrator would like to determine which users have not logged into TES within the last year, for example, the individual can:
- Go to the Manage menu.
- Select User Management.
- View the last LAST LOGIN date of each user at the institution.
MY TASKS
MY TASKS gives the individual user insight into the TES® Evaluation Tracker workflow usage at the institution.

Within this section, individuals can see:
- How many open evaluation tasks are currently assigned to the user.
- Individuals with the SERVICE EVAL user right can select the hyperlinked number under Evaluations To-Do to be taken right to the user's My Evaluations queue.
- Institution-level statistics:
- The total number of evaluations created at the institution.
- The total number of open evaluations at the institution.
- The total number of closed evaluations at the institution.
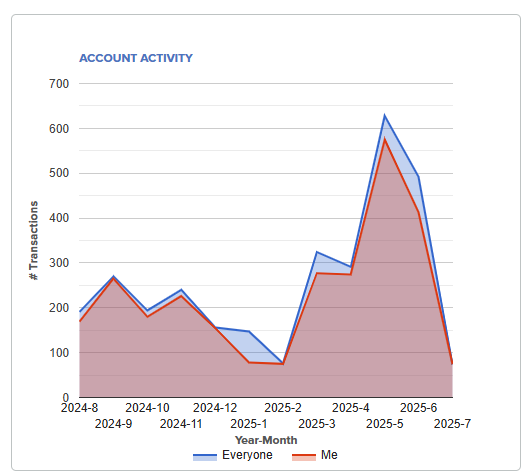
ACCOUNT ACTIVITY
Each time a user performs an action in TES®, whether it be viewing a course, an institution profile, creating an evaluation task, etc., a log of that activity is created. The ACCOUNT ACTIVITY graph depicts the number of actions taken by all TES users at the institutions in relation to the number of actions taken by the individual user over a 1-year period (the current date minus 365 days). In the example below, most of the activity that occurred in the CollegeSource University account within the last year was by the individual user currently viewing the Dashboard.
CATALOG STATUS TRACKING WATCHLIST
CollegeSource maintains an extensive database of college catalogs and makes every effort to ensure that catalog holdings are up to date. However, when going to build an equivalency or initiate an evaluation task, colleges may occasionally find an institution's catalog (and its corresponding course data set) unavailable.
A catalog may not be available in TES® when:
- An institution has not yet shared it with CollegeSource.
- A school revises its catalog throughout the academic year and asks CollegeSource not to publish it until it is complete.
- CollegeSource is no longer actively collecting catalogs from the institution.
Additionally, a catalog may have been received from an institution but is not yet available for use in TES because it needs to go through processing and quality control checks.
Within the Course Finder, users have the option to check a catalog's status, request a catalog be added to TES (assuming the catalog has not already been requested), and add a catalog to the institution's watchlist. This watchlist allows the users at the institution to follow the status of a catalog as it goes through production. The institution watchlist can be viewed and managed within the Course Finder and the Dashboard.
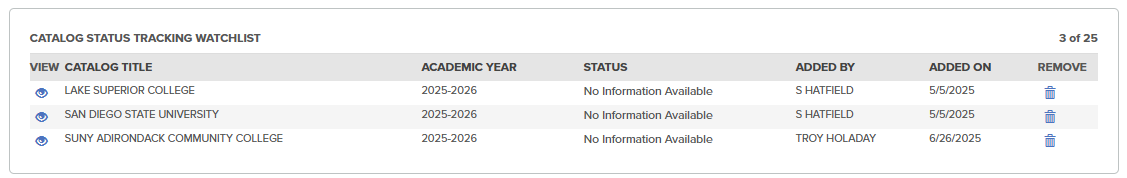
Where one or more catalogs have been added to the watchlist, the following information is displayed:
| Field | Description |
| VIEW |
Button to take the user to the CATALOG STATUS pop-up, where the following are noted: Catalog Title and Academic Year Catalog status:
File Received The file has been received by CollegeSource; it has not yet entered the processing stage. In Progress Catalog processing is underway. Quality Control Catalog import and processing is complete; data quality analysis is now occurring. Completed The catalog and data set now available for use in TES; the user will need to remove the catalog title from the institution watchlist A blank circle indicates that a stage has not begun. Once a stage is entered into, an angle bracket ( > ) will appear in the status circle; when a stage is complete, a checkmark will be noted. If a user (including one outside the institution's account) has already requested the catalog, a note will appear indicating this. If the catalog has been added to the institution's watchlist, a message will indicate this along with the First Name and Last Name of the user who made the addition. |
| CATALOG TITLE | The title of the institution catalog requested. |
| ACADEMIC YEAR | The academic year for which the catalog was requested. |
| STATUS |
The catalog receipt and processing statuses: No Information Available File Received In Progress Quality Control Completed |
| ADDED BY |
The name of the user who added the catalog to the watchlist. Format: First, Last |
| ADDED ON |
Date on which the catalog was added to the watchlist Format: MM/DD/YYYY |
| REMOVE |
The button to remove the catalog title from the institution's watchlist. TES Administrators can remove any catalog title from the institution's watchlist; any other user can only remove catalog titles that the individual added. If a user is not authorized to remove a catalog title, the button/icon will not be visible on the row:
|
|
|
|


See Catalog Status Tracking: Check the Status of and Request a School's Catalog for further information about requesting catalogs and managing the institution's watchlist.